The ultimate app for wind analysis
WindRose gives you real-time, precise wind data to plan your perfect session.


Real-time wind conditions
Check the wind trend over the last or next 12 hours to get a clear picture of the sea conditions you'll encounter.
At a glance
The wind trend over land in the past 12 hours is key to knowing whether the sea will be choppy or glassy. Don’t take chances—check WindRose before every session.

Access thousands of spots
WindRose offers free forecasts for over 3,000 surf spots around the world—and counting!
Wind-Rose Chart
WindRose shows how wind directions at 10 m above sea level have behaved over time. This tool helps you understand the current sea state, since recent wind directly influences wave conditions.
Why is it important?
When it comes to surfing, waves are king—but having the right wind direction over time makes the difference in finding the perfect session at your favorite spot.
To plan your daily surf session, it’s far more useful to know how the wind has blown in the past hours (or will in the next hours) than to worry about long-term forecasts. If the wind has been steady and offshore recently—or is expected to be—you're more likely to find clean, glassy waves rather than a messy sea.
Perfect direction? It depends on the spot. Using WindRose’s satellite view, see where you are and look for offshore winds—those blowing from land toward the sea. That’s the ideal wind direction.
What about wind strength? If you have strong offshore winds and enough swell, get ready for an epic surf session! But if the wind is strong and not offshore—or if it keeps shifting—you’re in for a battle, my friend.
What happens when the radar shows many shifts in wind direction over time but low intensity? You’ll likely see a choppy sea, less clean wave faces, and overall a “not-so-good” session.
How to read WindRose
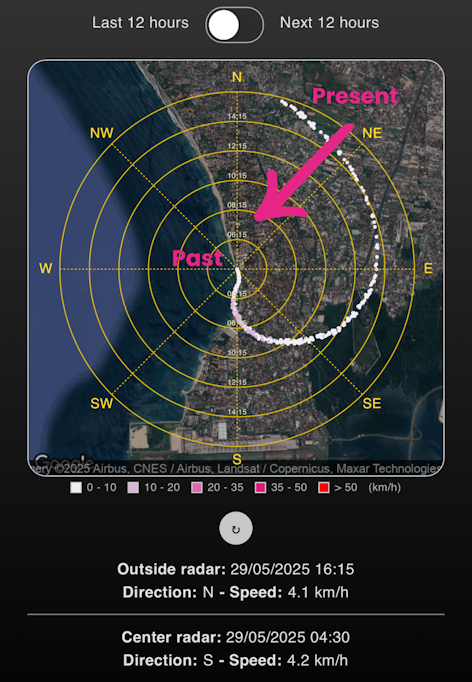
The chart is made up of concentric rings, each representing a 2-hour period, totaling 12 hours. You can toggle between viewing the last 12 hours or the next 12 hours of wind data. The outermost ring is always “now,” and rings toward the center represent past or future hours based on your selection:
Last 12 Hours: The outer ring shows the most recent data and the inner rings show progressively older data, helping you track how wind direction and strength changed over the past 12 hours.
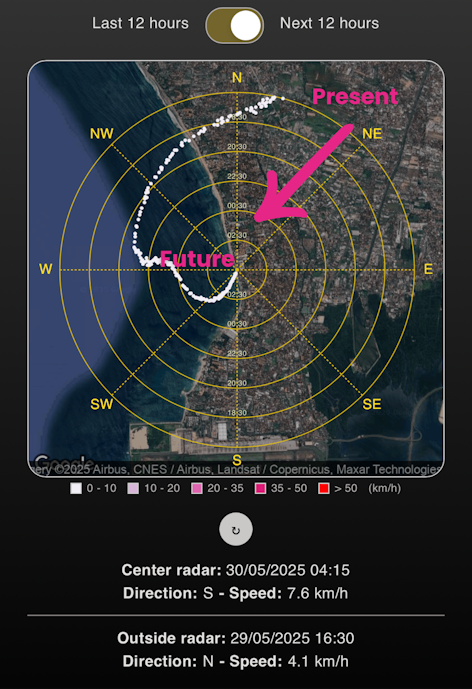
Next 12 Hours: The outer ring shows the current wind, and the inner rings show projected conditions for the next 12 hours, letting you anticipate how wind will evolve.
Thanks to WindRose, you can intuitively visualize how wind affects the sea—past and future—and make informed decisions.
Intensity Colors
The chart’s colors indicate wind strength. Lighter shades mean lower wind speeds; darker tones mean stronger winds.
These are the speed ranges and their associated colors:
Time-Range Selection
Using the “Time” selector, toggle between last 12 hours or next 12 hours of data to analyze wind trends.
Last 12 Hours: The outer ring shows the most recent data and the inner rings show progressively older data, helping you track how wind direction and strength changed over the past 12 hours.

Next 12 Hours: The outer ring shows the current wind, and the inner rings show projected conditions for the next 12 hours, letting you anticipate how wind will evolve.

Make smarter surf session choices with WindRose
Get it now — totally free!